
2021 ~ 2026 Adducate User Analytics Report
1. About Adducate (adducate.net)
Adducate is an open educational content platform designed to support education in developing countries and underprivileged communities. After planning in 2020, the platform launched in June 2021. Adducate enables all students to learn, regardless of their internet access or English proficiency.
The platform operates through content donations from educational organizations and contributors and organizations from Korea, the United States, Canada, and Europe.
Instead of focusing on prolonged user engagement, the website helps users quickly locate and download the content they need. This strategy naturally leads to more new visitors seeking specific materials rather than returning users. This approach is tailored for our target users—students and teachers in developing countries and underserved educational communities in developed nations. By reducing network costs and making open-source content easily accessible, the platform allows a single user (typically a teacher) to download materials and distribute them within their community.
Through Adducate, we're creating a world where every student can learn freely, regardless of their circumstances.
2. Executive Summary
Twice a year, both subjects and their content are updated. In the early days of the platform, each subject contained only a small number of materials, but this gradually increased over time. The platform itself also evolved in response to the growing and changing content structure.
This report presents a comprehensive analysis of Adducate’s user data from 2021 to August 2026, highlighting key trends in growth, geographic reach, and engagement patterns.
3. User Growth and Trends
Overall User Growth
- Total count of Country: 112
- Total cumulative monthly users from 2021.06 to 2026.08: 12,453
- Total engagement duration: 4,299,318 sec (71,655 min)
Cumulative Monthly Users
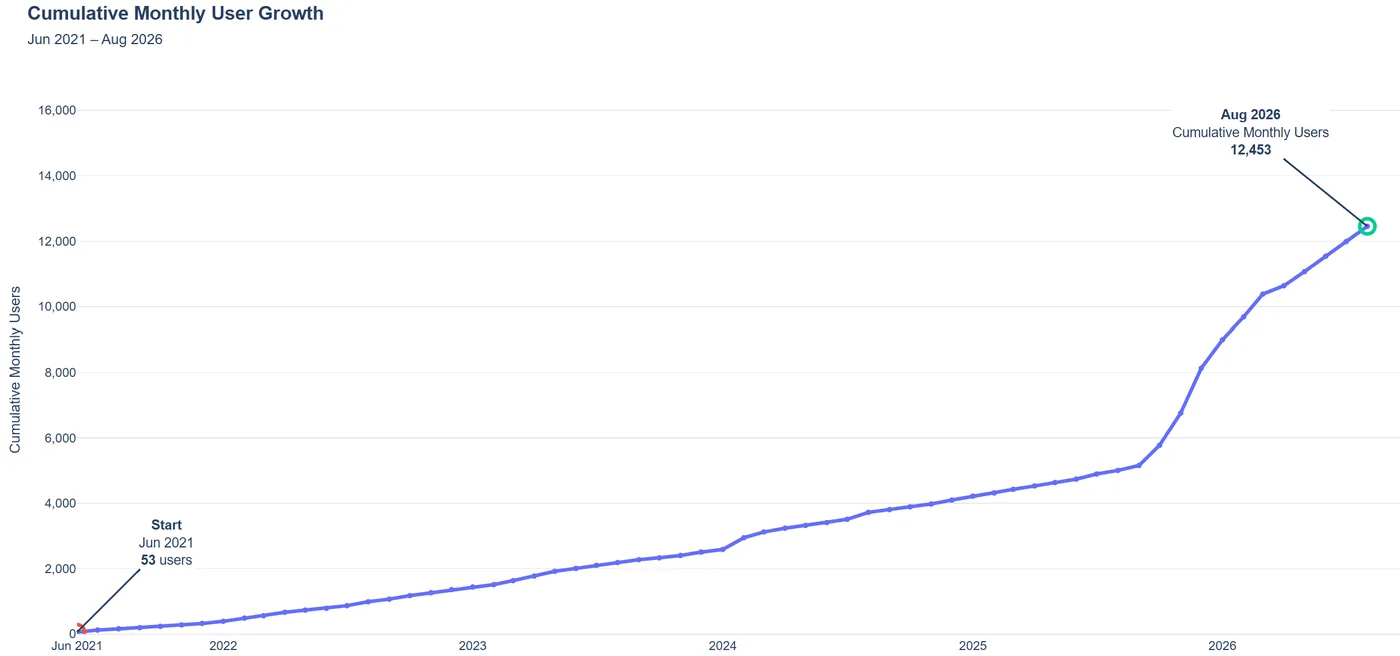
- Adducate recorded substantial cumulative monthly user growth from June 2021 to August 2026, reflecting a significant expansion in platform usage over the five-year period.
- Growth was gradual and relatively stable between June 2021 and 2023. The cumulative total increased steadily during this period, indicating that the platform was building its user base at a consistent but moderate pace.
- The growth curve began to steepen during 2024, signaling an acceleration in monthly user acquisition compared with the platform's earlier years.
- A major turning point is visible in the second half of 2025, when the cumulative curve becomes significantly steeper. This corresponds with the sharp increase in monthly users observed in the monthly trend analysis.
- The momentum continued into 2026. By August 2026, cumulative monthly user volume had reached 12,453, with a substantial portion of the overall growth occurring during the most recent period.
- Overall, the changing slope of the curve suggests that Adducate moved from a period of gradual early-stage growth to a substantially faster expansion phase, particularly from late 2025 onward.
Temporal Usage Analysis
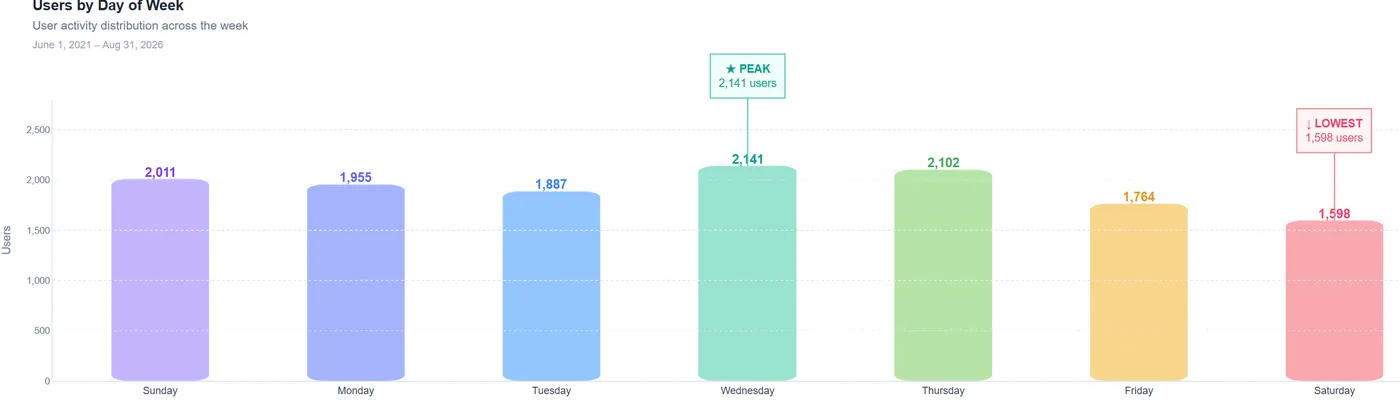
The day-of-week analysis from June 2021 through August 2026 shows that Wednesday records the highest user activity with 2,141 users, followed closely by Thursday with 2,102 users. In contrast, Saturday has the lowest activity with 1,598 users, while Friday is also relatively low at 1,764 users.
Overall, user activity appears to peak in the middle of the workweek, particularly on Wednesday and Thursday, before declining toward the weekend. This pattern suggests that Adducate usage may be more closely associated with weekday learning or work-related activities than with weekend engagement. Since GA4 totalUsers can include the same user across multiple days of the week, these weekday figures should not be summed and interpreted as the total number of unique users.
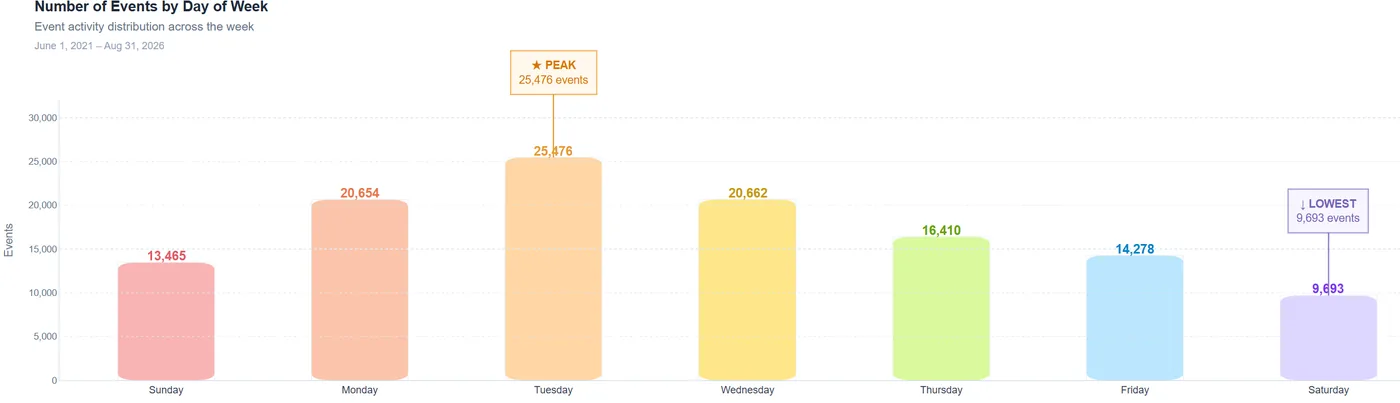
The day-of-week event analysis from June 2021 through August 2026 shows that Tuesday records the highest level of activity with 25,476 events, followed by Wednesday with 20,662 and Monday with 20,654. In contrast, Saturday records the lowest event activity with 9,693 events.
Overall, event activity increases toward the beginning of the workweek, peaks on Tuesday, and then gradually declines toward the weekend. The particularly high event volume on Tuesday suggests that users are not only visiting the platform but also interacting more actively with its content and features on that day.
4. Geographic Distribution of Users
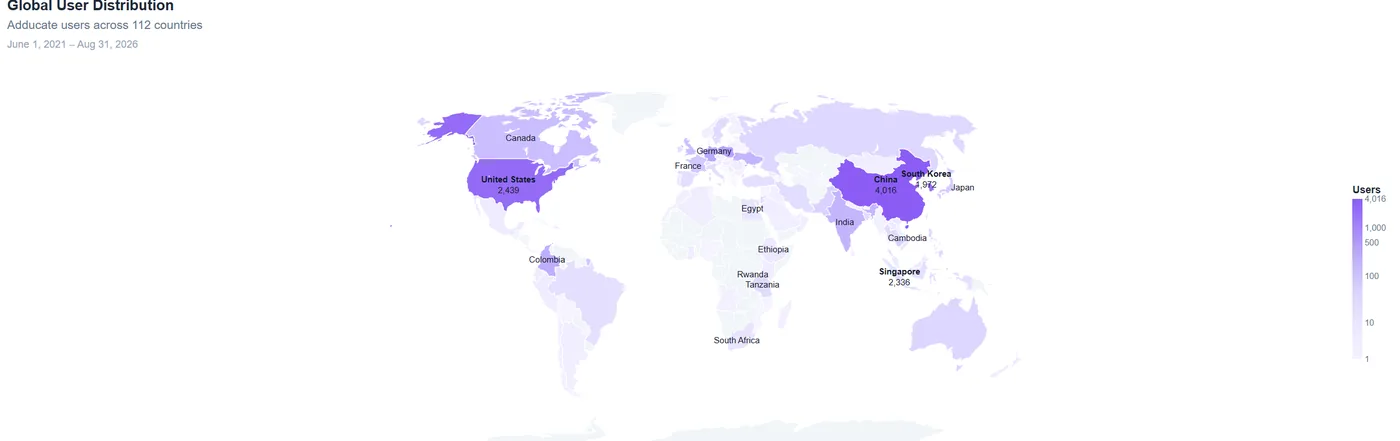
From June 2021 through August 2026, Adducate users were identified across 112 countries, demonstrating a broad international reach that extends well beyond a single country or region. China represents the largest user market with 4,016 users, followed by the United States (2,439), Singapore (2,336), and South Korea (1,972). The substantial gap between these leading markets and the remaining countries indicates that a significant portion of Adducate's user activity is concentrated within a relatively small number of core markets.
Geographically, the strongest user presence is found across East Asia and North America. China and South Korea represent major East Asian markets, while Singapore also stands out as a particularly strong user base in Southeast Asia. The United States represents another major concentration of users. At the same time, Adducate has reached users across Europe, South America, and Africa, including countries such as Germany, France, Colombia, Egypt, Ethiopia, Rwanda, Tanzania, and South Africa.
This distribution suggests that Adducate combines strong user concentration in several key markets with a geographically diverse global footprint. While the largest markets currently account for much of the platform's activity, the presence of users across 112 countries indicates potential opportunities for further international expansion. Markets with smaller but established user bases may provide useful signals for identifying emerging areas of adoption.
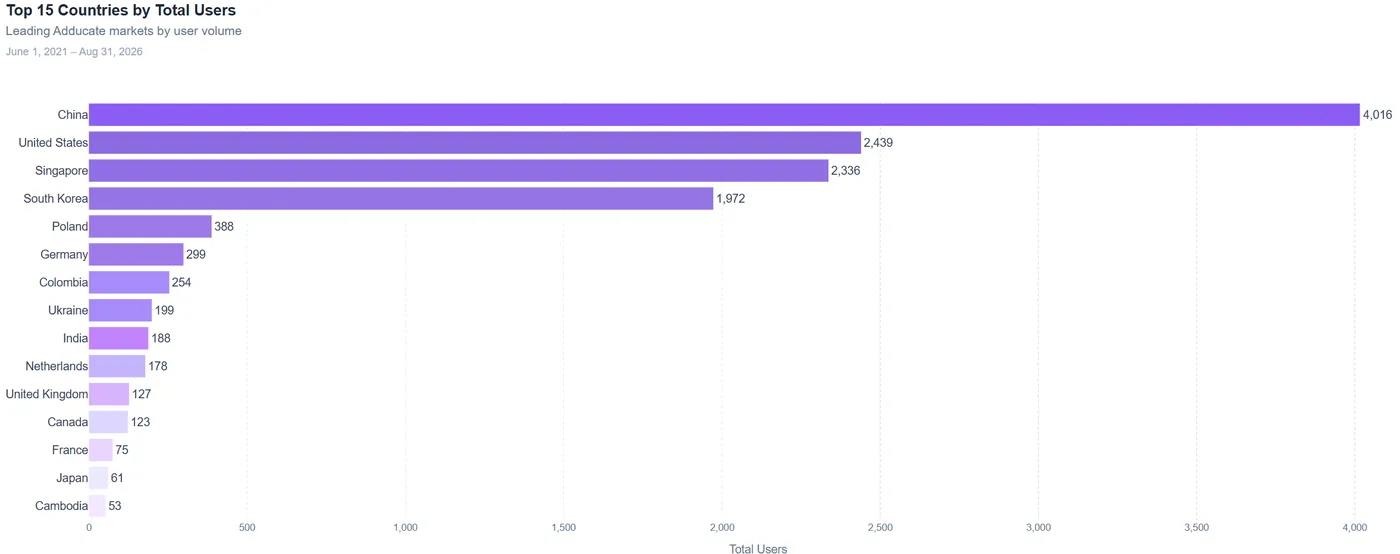
The Top 15 country ranking highlights the uneven distribution of Adducate users across leading markets. China ranks first with 4,016 users, followed by the United States (2,439), Singapore (2,336), and South Korea (1,972).
The most striking feature is the sharp drop after the fourth-ranked market. South Korea records 1,972 users, while Poland, ranked fifth, has only 388. From that point onward, the differences between countries become much smaller, with Germany, Colombia, Ukraine, India, and the Netherlands forming a relatively compact second tier.
This creates a clear two-level structure: four dominant markets at the top, followed by a long tail of much smaller markets. In other words, the ranking shows that Adducate’s user volume is driven disproportionately by a small group of countries rather than being evenly distributed among its leading markets.
5. User Engagement Analysis
Engagement Duration
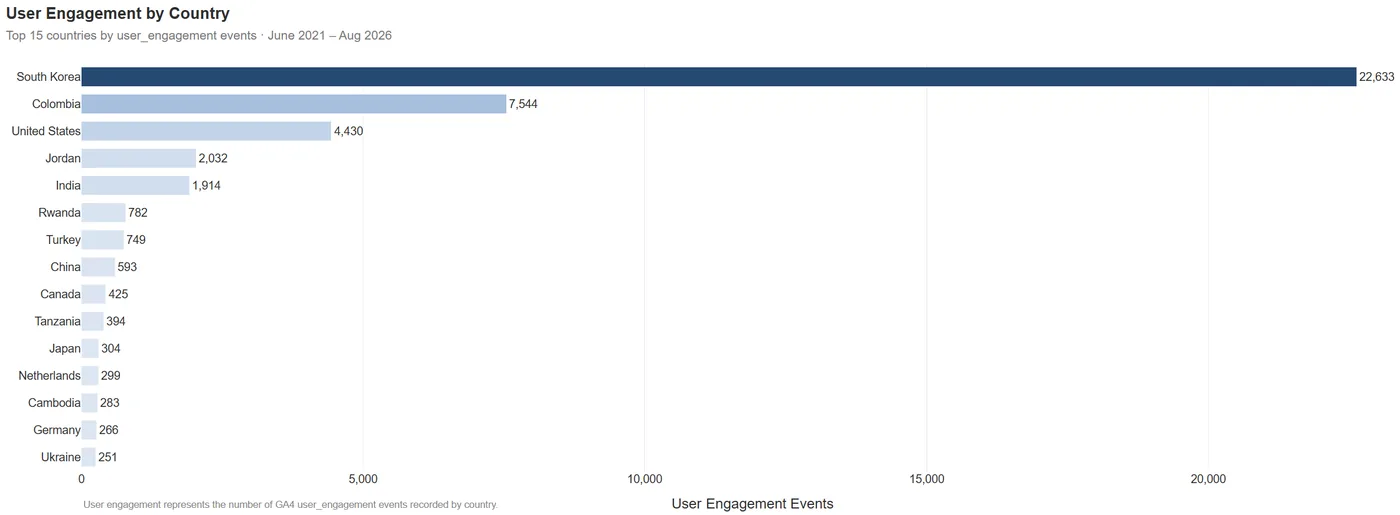
Country-level engagement data from June 2021 to August 2026 shows that South Korea is the dominant engagement market, generating 22,633 user_engagement events. This is approximately three times the volume recorded in Colombia (7,544) and more than five times that of the United States (4,430), demonstrating that Adducate’s engagement base remains strongly centered in South Korea.
At the same time, meaningful engagement is clearly emerging outside the domestic market. Colombia stands out as a distinct second-largest engagement market, while the United States also contributes a substantial volume of activity. Together, the results reveal a clear three-market structure led by South Korea, followed by Colombia and the United States.
A second tier is formed by Jordan (2,032) and India (1,914), both showing notable levels of engagement. Smaller but persistent activity is also visible across Rwanda (782), Turkey (749), China (593), Canada (425), Tanzania (394), and Japan (304). Although these markets remain considerably smaller in absolute volume, their geographic diversity is significant: engagement is being generated across Asia, Latin America, North America, the Middle East, and Africa, indicating that Adducate’s active reach extends well beyond a single region.
Overall, the pattern suggests a platform with a strong South Korean engagement core accompanied by an increasingly diverse international footprint. Maintaining engagement in the core market while examining content preferences, acquisition channels, and user behavior in Colombia, the United States, Jordan, and India could help identify the most promising opportunities for further international growth.
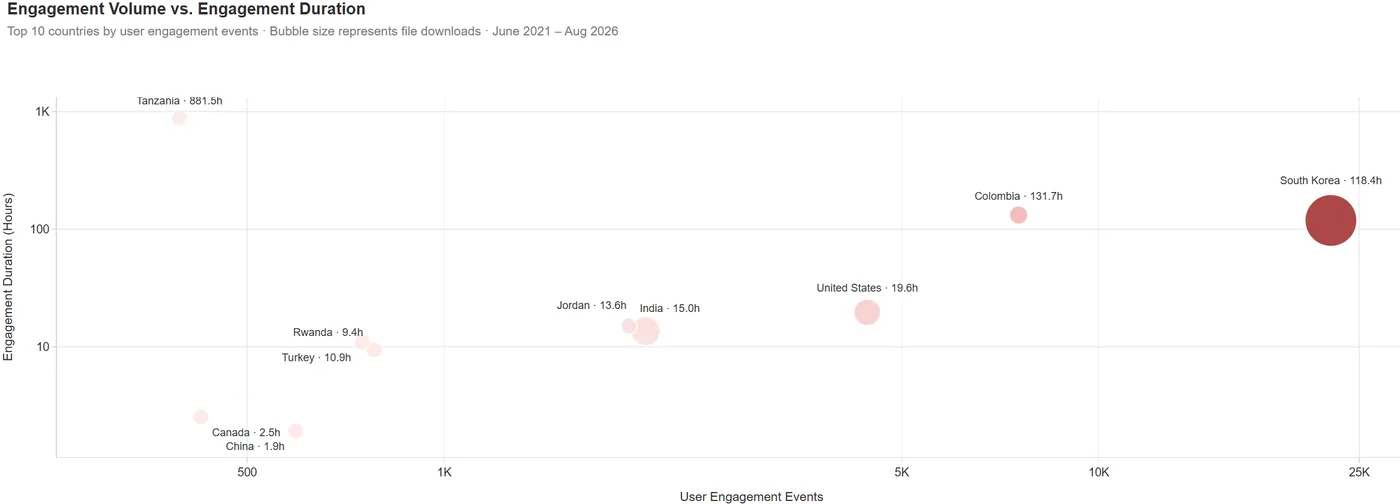
Comparing engagement volume with total engagement duration reveals substantial differences in how users interact with Adducate across markets, demonstrating that a high number of engagement events does not necessarily translate into longer overall engagement. Importantly, several of the patterns observed in the data can be better understood when Adducate's program history and operational context in each country are taken into account.
South Korea remains the largest market by activity, recording 22,633 engagement events and 118.4 hours of total engagement. Its notably large bubble also reflects strong file-download activity, indicating substantial interaction with downloadable educational resources. This reinforces South Korea's position as Adducate's primary market in terms of activity volume and content utilization.
Colombia presents a particularly meaningful engagement pattern. Despite recording 7,544 engagement events—roughly one-third of South Korea's volume—it accumulated 131.7 engagement hours, exceeding South Korea's total duration. This unusually high engagement depth is consistent with Adducate's operational history in Colombia, where the platform was used to support public-school English education for approximately three years. The sustained educational use of the platform provides important context for the longer accumulated engagement time and suggests that Colombia represents a case of deep, program-driven usage rather than simply high traffic volume.
The United States ranks third in engagement volume with 4,430 events, but its total engagement duration is considerably lower at 19.6 hours. India (15.0 hours), Jordan (13.6 hours), Turkey (10.9 hours), and Rwanda (9.4 hours) show similar patterns: meaningful levels of activity are present, but accumulated engagement time remains relatively modest. This illustrates the distinction between engagement frequency and engagement depth across markets.
Tanzania stands out as the most distinctive case, accumulating 881.5 engagement hours from only around 394 engagement events. However, this pattern becomes considerably more understandable when Adducate's organizational history is considered. Tanzania has been closely connected with the project since its early stages, with the team continuously promoting Adducate in the country, while members of the Tanzania-based team have also been involved in the platform's development. Consequently, the exceptionally high engagement duration may reflect a combination of external user activity and sustained internal or development-related platform usage, rather than conventional end-user engagement alone. Tanzania should therefore be interpreted as a special operational case rather than directly compared with ordinary user markets.
Overall, the chart shows that country-level engagement metrics need to be interpreted alongside the operational context behind platform usage. South Korea demonstrates the greatest scale and strong content utilization, while Colombia illustrates sustained educational engagement associated with long-term public-school implementation. Tanzania, meanwhile, reflects Adducate's long-standing local involvement and development activities, which likely contribute to its exceptionally high engagement duration.
These findings also suggest that future analysis could distinguish between general users, educational-program participants, and internal/development users where possible. Doing so would provide an even clearer picture of organic user engagement and allow country-level comparisons to reflect differences in how Adducate is actually being used.
Analytics regarding File Download and User Engagement
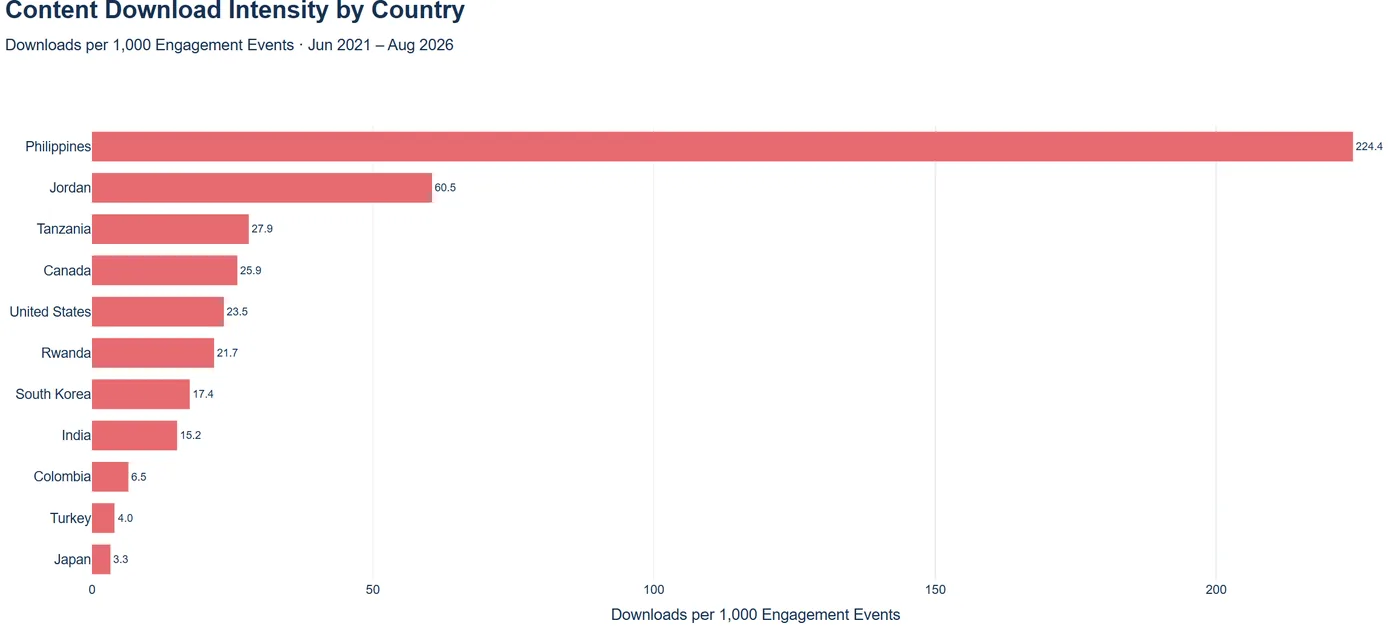
- The analysis measures content download intensity, defined as the number of file downloads per 1,000 user engagement events. This allows countries with different levels of overall activity to be compared on a more standardized basis.
- The Philippines recorded the highest download intensity at 224.4 downloads per 1,000 engagement events, substantially exceeding all other countries. This suggests that users in the Philippines were particularly likely to download educational materials relative to their level of engagement with the platform.
- Jordan ranked second with 60.5 downloads per 1,000 engagement events, followed by Tanzania (27.9), Canada (25.9), and the United States (23.5).
- South Korea recorded 17.4 downloads per 1,000 engagement events. Although South Korea generated the largest absolute volume of both downloads and engagement, its normalized download intensity was lower than several smaller markets. This illustrates the difference between overall platform activity and download-oriented usage behavior.
- Colombia recorded 6.5 downloads per 1,000 engagement events, despite having relatively high overall engagement. This indicates that users may be interacting with the platform in ways that do not necessarily result in immediate file downloads.
- Overall, the results demonstrate that high engagement volume does not automatically translate into high download intensity. Usage patterns differ considerably by country, suggesting that educational content may be consumed and accessed differently across geographic markets.
Engagement Rate by Page Path (Content Performance by Subject)
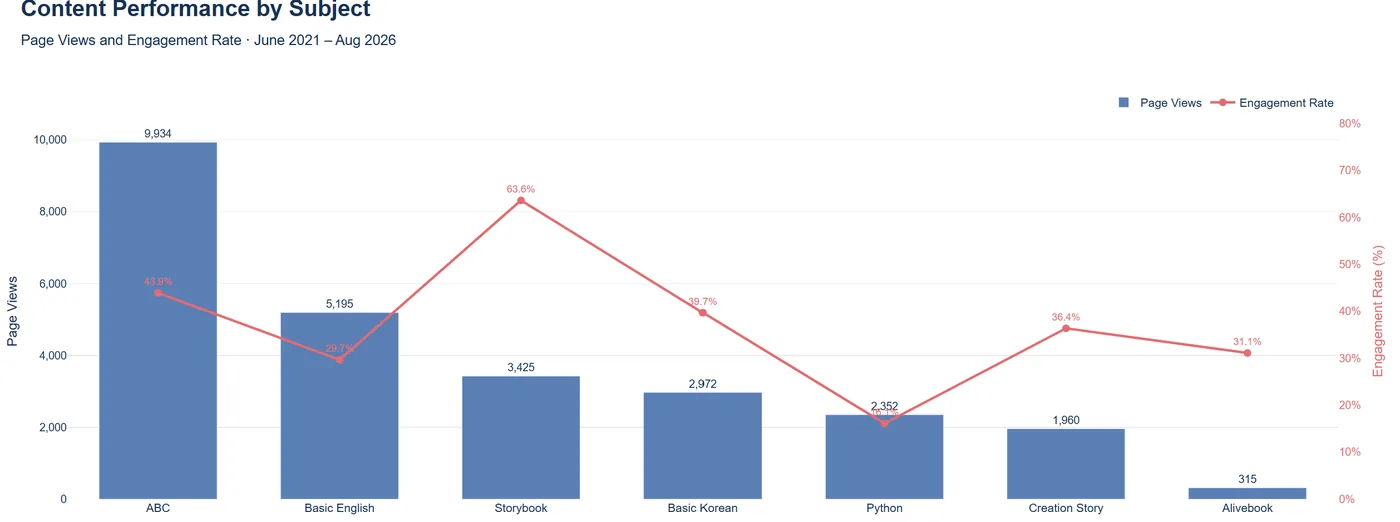
ABC (refers to Adducate’s basic English learning materials designed to help learners build foundational English skills, including the alphabet, phonics, and sight words.) emerged as the most widely accessed subject, generating 9,934 page views while maintaining a 43.9% engagement rate. Storybook showed a different but particularly notable pattern: despite receiving fewer views (3,425), it achieved the highest engagement rate at 63.6%, indicating strong user engagement among those who accessed the content.
Basic English recorded the second-highest traffic with 5,195 views, although its engagement rate was comparatively lower at 29.7%. Python showed the clearest gap between access and engagement, receiving 2,352 views but recording the lowest engagement rate at 16.1%. While this may warrant further examination of the content structure and user journey within the Python section, the low engagement rate may also reflect technical and accessibility barriers faced by learners in developing-country contexts. Unlike language-learning materials that can be consumed directly through a browser, effective Python learning often requires access to a suitable coding environment, such as an IDE or online compiler, which may be more difficult to set up or use under limited device or connectivity conditions. Mobile-first access may present an additional challenge, as writing and executing code on smartphones can be less convenient than accessing text- or image-based learning materials. These factors should be investigated further before attributing the lower engagement solely to the content itself.
Overall, the results show that content popularity and user engagement do not necessarily move together. ABC performs strongly in terms of overall reach, while Storybook stands out for engagement quality. Python, meanwhile, highlights the importance of considering not only content design but also the technical environment and accessibility conditions in which learners engage with educational materials. Examining these dimensions together therefore provides a more complete picture of how Adducate's educational content is being used.
Country-Specific Content Consumption
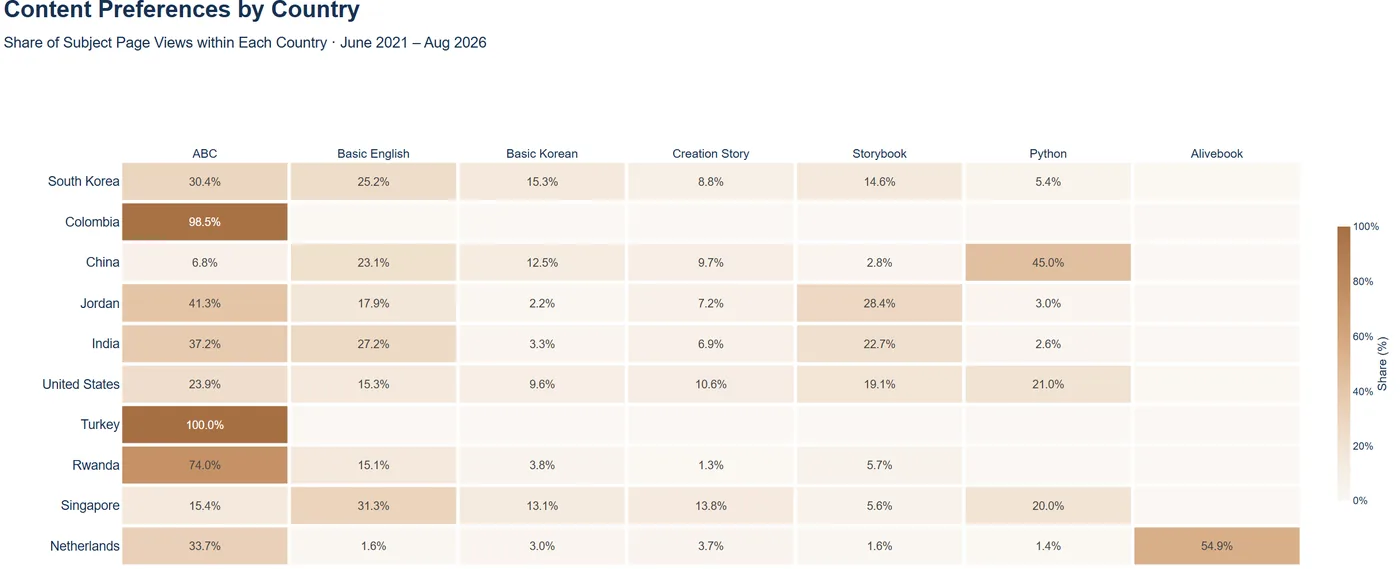
- Content preferences varied substantially across countries, indicating that Adducate is used differently across geographic markets. ABC, Adducate's foundational English-learning content, was the dominant subject in several countries, accounting for 98.5% of subject page views in Colombia, 74.0% in Rwanda, 41.3% in Jordan, and 37.2% in India.
- South Korea showed the most diversified content consumption pattern. ABC represented 30.4% of subject views, followed by Basic English (25.2%), Basic Korean (15.3%), Storybook (14.6%), and Creation Story (8.8%). Rather than concentrating on a single subject, users accessed a broad range of Adducate's educational materials.
- Jordan and India displayed similar patterns, with foundational English content playing a central role while Storybook also attracted substantial attention. Storybook accounted for 28.4% of views in Jordan and 22.7% in India, suggesting meaningful demand for story-based learning alongside basic English education.
- Some markets showed highly distinctive subject patterns. Python represented 45.0% of subject views in China, while it accounted for 21.0% in the United States and 20.0% in Singapore. Singapore also recorded the highest share of Basic English among the countries shown at 31.3%.
- The Netherlands showed a particularly high concentration of Alivebook views, accounting for 54.9% of the seven analyzed subject categories. However, this pattern should be interpreted in the context of UX testing conducted in the Netherlands, which focused particularly on Alivebook. The testing activity likely contributed to the unusually high share of Alivebook traffic and therefore may not represent the broader content preferences of users in the Netherlands. This illustrates the importance of considering project activities and testing contexts when interpreting country-level analytics.
- Overall, the results demonstrate that there is no single content-consumption pattern across Adducate's international audience. Foundational English materials dominate in several markets, while programming, storytelling, and other specialized resources are prominent in others. However, country-level patterns should be interpreted alongside known operational activities, such as UX testing or targeted content initiatives, as these activities can substantially influence observed traffic distributions. With this context considered, geographic differences can provide useful insights for future content development and country-specific distribution strategies.
6. Traffic Sources
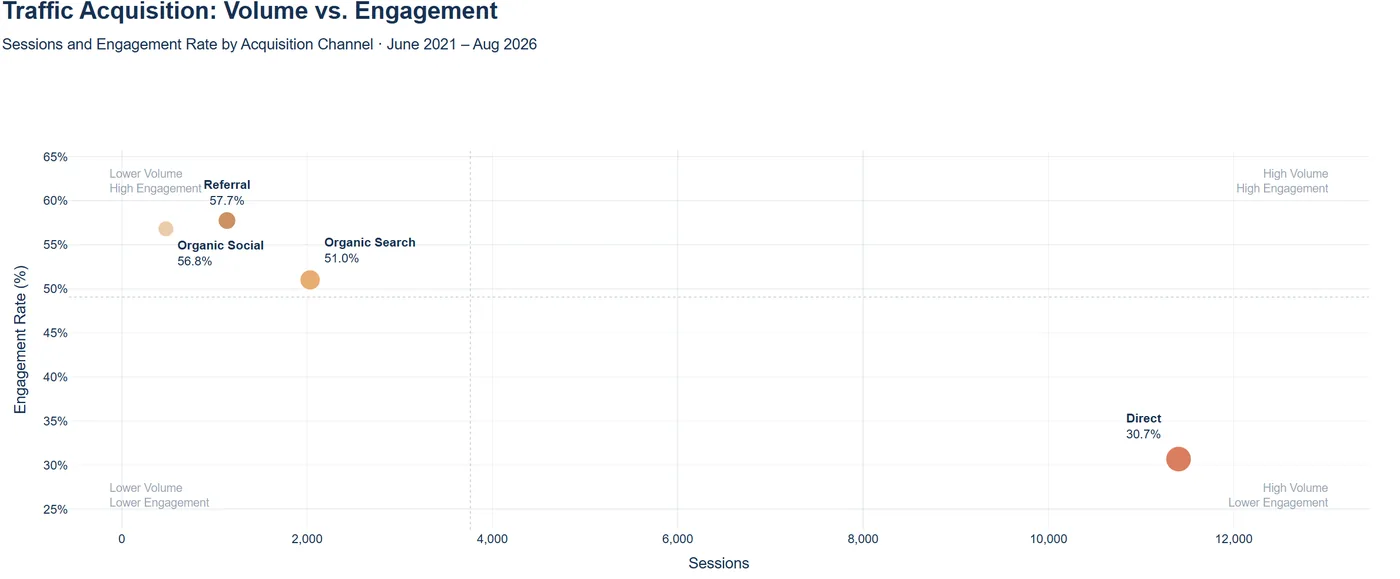
- Direct traffic overwhelmingly dominated Adducate's acquisition volume, generating 11,405 sessions—far more than any other major channel. Its engagement rate was 30.7%, the lowest among the four primary acquisition channels. However, this lower engagement rate should not necessarily be interpreted as indicating lower-quality traffic. Direct traffic may include existing teachers or returning users who access Adducate through bookmarks or saved links with a specific purpose, such as locating and immediately downloading a particular learning resource. These task-oriented visits can result in shorter or less interactive sessions while still representing successful and valuable use of the platform.
- In contrast, externally acquired traffic demonstrated substantially stronger engagement. Referral recorded the highest engagement rate at 57.7%, followed closely by Organic Social at 56.8% and Organic Search at 51.0%. Each of these channels achieved an engagement rate above 50%, despite generating considerably fewer sessions than Direct. This pattern suggests that users arriving through external discovery channels tend to engage with the platform differently from those accessing it directly.
- Organic Search combines the second-largest traffic volume (2,033 sessions) with a strong 51.0% engagement rate. One possible explanation is that users discovering Adducate through search engines arrive while actively looking for relevant educational resources, potentially encouraging further exploration of the platform. However, additional behavioral data would be needed to determine whether search users consistently demonstrate stronger learning intent.
- Referral traffic shows a similarly notable pattern. Although it generated only 1,136 sessions, its 57.7% engagement rate was nearly twice that of Direct traffic. Organic Social showed a comparable pattern, with 477 sessions and a 56.8% engagement rate. These channels therefore contribute smaller traffic volumes while generating relatively high levels of measured engagement.
- Taken together, the results indicate that Adducate's acquisition channels may support different types of user behavior rather than simply different levels of traffic quality. Direct traffic provides the majority of sessions and may include purposeful, resource-oriented visits from existing users, while Organic Search, Referral, and Organic Social generate smaller volumes but higher measured engagement rates. Future analysis combining acquisition channels with file-download events, returning-user behavior, session duration, and navigation paths could help determine whether lower-engagement Direct sessions represent quick, successful task completion or genuinely limited interaction with the platform.
7. Conclusion
From 2021 through August 2026, Adducate has evolved from an early-stage educational platform into a globally accessed learning resource with a growing and increasingly diverse user base. Usage expanded gradually during the platform’s first years, accelerated during 2024, and entered a noticeably faster growth phase from the second half of 2025 onward. By August 2026, the cumulative sum of monthly users had reached 12,453, reflecting a clear increase in platform activity and momentum over time. As this figure represents the sum of monthly users rather than unique individuals, the most important signal is not the absolute cumulative number itself, but the sustained acceleration in usage during the most recent period.
Adducate’s reach has also become meaningfully international. Users have been identified across 112 countries, with China, the United States, Singapore, and South Korea forming the largest user markets. At the same time, activity extends across Europe, Latin America, Africa, the Middle East, and other parts of Asia. This combination of several strong core markets and a long tail of smaller international markets suggests that Adducate has established both a solid usage base and a broad foundation for future expansion.
However, the analysis also demonstrates that user volume alone does not fully explain how Adducate creates value. South Korea remains the strongest market in terms of engagement activity, while Colombia records unusually deep engagement relative to its volume. Download behavior also differs considerably by market: countries with relatively modest engagement volumes, such as the Philippines and Jordan, show particularly high download intensity. These differences reinforce an important point—Adducate users do not all interact with the platform in the same way, and the value of the platform cannot be assessed through traffic volume alone.
The same pattern is visible at the content level. ABC, Adducate’s foundational English-learning content, provides the broadest reach, while Storybook achieves the strongest engagement rate among the major subjects. Python, in contrast, attracts meaningful traffic but shows comparatively low engagement. Rather than necessarily indicating a content-quality issue, this pattern may partly reflect technical and accessibility barriers, such as the need for a suitable coding environment or the difficulty of writing and executing code on mobile devices, particularly in contexts where access to devices or connectivity may be limited.
Country-level patterns further demonstrate that Adducate content is used differently across markets: foundational English dominates in countries such as Colombia and Rwanda, Storybook is particularly prominent in Jordan and India, and Python accounts for a substantial share of subject views in China, the United States, and Singapore. Alivebook is unusually concentrated in the Netherlands; however, this pattern should be interpreted in the context of Alivebook-focused UX testing conducted there. The testing activity likely contributed to the high proportion of Alivebook views and therefore should not be interpreted as evidence of broader Dutch user preference.
Together, these findings suggest that future content planning should consider not only where content is accessed, what users in each market seek, and how learning materials perform beyond simple page-view counts, but also the technical, operational, and testing contexts that can shape observed usage patterns.
Traffic acquisition presents another clear strategic opportunity. Direct traffic currently provides the majority of Adducate’s session volume, although its engagement rate (30.7%) is substantially lower than that of Organic Search, Referral, and Organic Social. However, this should not necessarily be interpreted as lower-quality traffic. Direct visits may include existing teachers or returning users who access Adducate through bookmarks or saved links with a specific purpose, such as locating and immediately downloading a particular educational resource. These task-oriented visits may naturally result in shorter or less interactive sessions while still representing successful and valuable use of the platform.
Organic Search combines meaningful traffic volume with a 51.0% engagement rate, while Referral and Organic Social achieve even higher engagement rates despite smaller volumes. These channels appear to encourage broader interaction with the platform, although their usage patterns may differ fundamentally from those of Direct visitors. Strengthening search visibility, partnerships, referral pathways, and organic content distribution could therefore help Adducate diversify its acquisition base, while further analysis of file-download events, returning-user behavior, and navigation paths could clarify whether Direct traffic’s lower measured engagement reflects limited interaction or efficient task completion by existing users.
Taken together, the findings suggest that Adducate is entering a new stage of development. The platform has demonstrated that its educational resources can reach users across a wide range of countries, while the rapid growth observed since late 2025 indicates increasing momentum. The next opportunity is not simply to generate more traffic, but to translate that growth into more purposeful and sustainable educational use. This means strengthening the content that already performs well, improving areas with weaker engagement, adapting distribution strategies to country-specific demand, and expanding high-quality acquisition channels.
Most importantly, future success should remain aligned with Adducate’s original mission. The platform was designed not to maximize time spent on the website, but to help students and educators quickly access, download, and redistribute educational materials—particularly in communities where internet access, language, or educational resources may be limited. Therefore, the strongest measure of Adducate’s long-term impact will not be engagement for its own sake, but its ability to connect the right educational content with the right learners, in the right places, as efficiently and accessibly as possible.
Interested in exploring our progress since 2020?
Adducate was conceived in 2020 and launched in 2021. Twice a year, both subjects and their content are updated. In the early days of the platform, each subject contained only a small number of materials, but this gradually increased over time. The platform itself also evolved in response to the growing and changing content structure. For those involved in Adducate, the comprehensive data analysis reports were published quarterly. The summary provides a brief overview of the complete data from 2021 to 2026. We've written this analysis in simple, clear language to make it accessible to everyone. We will continue sharing data analysis reports here.